
The real FX performance of an export business is not measured by accounting gains or losses.
It is measured by the difference between the order cost rate and the realised exchange rate on every export bill.
Through independent research, detailed bill-level analysis, market benchmarking, and treasury advisory, we help management understand where value is being created, where margins are being lost, and what actions can improve future foreign exchange performance.
Every export bill has a lifecycle. We track the whole journey — not just the last step.
Most businesses only see the final credited rate. We track every stage — order to realisation — producing three performance numbers on every settled bill.
Three numbers, calculated on every settled bill.
The gain or loss in your books of account is only one of three ways to measure FX performance. Each answers a different question. All three, together, tell the complete story.
Seven capabilities. One connected system.

- Live rates for all major currency pairs, sourced from real-time interbank rates
- Forward rates across all tenors — enter your due date to see the custom forward rate that applies
- Set your own rate alerts, notified the moment your threshold is reached
- Available on both mobile and desktop
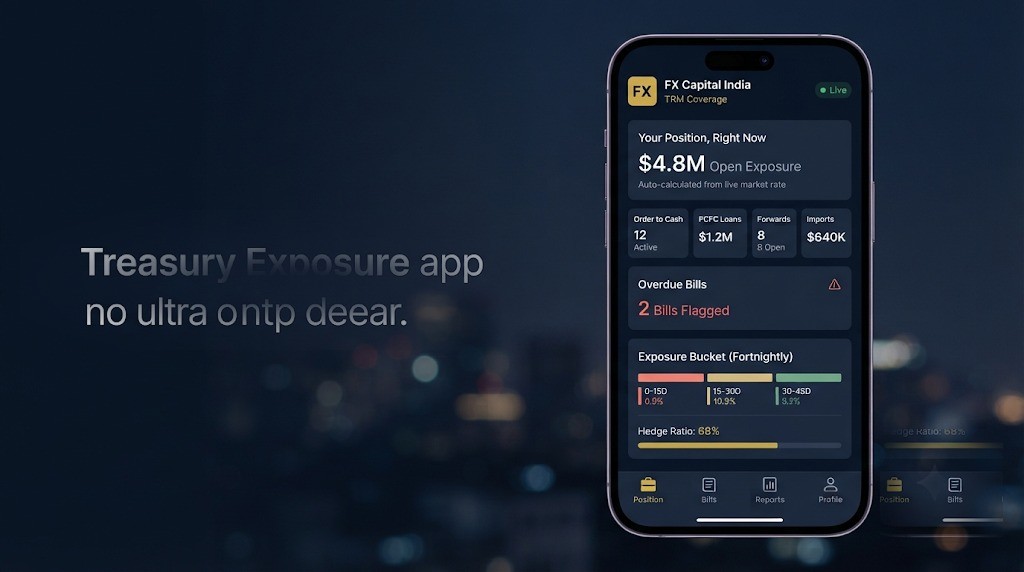
- Order-to-cash cycle tracked end to end, across multiple banks in one view
- PCFC loans, forwards, and import exposures — all live, all in one system
- Integrated directly with the live rate feed — MTM auto-calculates against the actual market, not a stale end-of-day snapshot
- One click shows exactly where you stand, right now — no waiting, no manual pulling of numbers
- Overdue bills flagged automatically, before they become a problem
- Fortnightly exposure bucket and hedge ratio, always current

- Every realised bill, individually assessed — not a blended average that hides the weak ones
- Bill-wise profitability shown after shortfall and exchange gain/loss, based on cost rate
- Each bill's performance evaluated against how the market actually moved during its exposure window
- The same Three-GL discipline applied automatically to every settled bill
- History that shows a pattern — not just a single month's snapshot
- Daily, weekly, and monthly research reports on currency movement
- Real-time market trend updates delivered straight to WhatsApp
- Every report is built from your own TRM output, your risk profile, and your written risk policy — not a market-wide newsletter
- Our team turns that data into a customised outcome — a specific recommendation for your position
- The result: high data transparency, so decisions are made on evidence, not guesswork
- A hedging policy designed specifically for your business — your order cycle, your currency mix, your margin structure
- Every hedging decision follows a defined rule, benchmarked against your overall business objective — protecting the margin already built into your price, not predicting where the market will go
- Removes uncertainty from the most consequential financial decision your business makes every month
- Gives your finance team a framework to execute immediately — without waiting for a call
- Every hedging method in use — forwards, PCFC, import netting — reviewed monthly for whether it's still economically effective, not just accounting-compliant
- In a highly volatile market, a method that worked six months ago may no longer be the competent choice — this review catches that shift before it costs you
- Exposure position, forward MTM, and settled bill performance assessed together, against your written policy and your business objective
- Where a method is underperforming, we diagnose why — and adjust: policy, hedge ratios, forward tenors, or product mix
- The goal is not to eliminate FX movement — it is to keep your hedging approach economically justified, month after month
- We manage the treasury function end-to-end on your behalf, following your written risk policy
- Structured training for your finance team — covering the risk policy, hedging methods, bank negotiation, and the other specialist skills a treasury function actually requires
- Not a quick walkthrough — this builds real, durable capability inside your business, not a dependency on us for every call
Either way, the same risk policy sits underneath both paths — you're choosing who executes it, not changing what's being followed.
Beat the market baseline. Every rolling twelve months.
Over a rolling 12 months, your blended realised rate should beat the market baseline — the simple average of daily spot rates during your exposure windows. We track this comparison every month and report it to you.
We carry no banking products. We earn no commission. Our advice is formed from your data and measured against an independent market benchmark.
Call us for a free risk performance analysis.
We calculate all three GL methods on your last three months of forwards and realised rates, and show you exactly where the gap is — at no cost, no commitment.